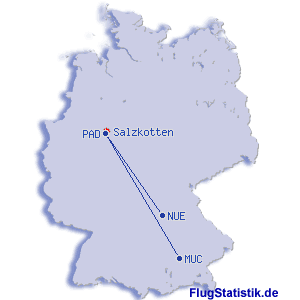
Top Ten Flughäfen
| # | Flughafen | Anzahl | Prozent |
|---|
| 1 |
PAD |
Paderborn/Lippstadt |
36 |
26,1 % |
| 2 |
PMI |
Palma de Mallorca |
24 |
17,4 % |
| 3 |
HAM |
Hamburg |
8 |
5,8 % |
| 4 |
DUS |
Düsseldorf |
6 |
4,3 % |
| 5 |
MUC |
München |
5 |
3,6 % |
| 6 |
FRA |
Frankfurt |
5 |
3,6 % |
| 7 |
DUB |
Dublin |
4 |
2,9 % |
| 8 |
NUE |
Nürnberg |
4 |
2,9 % |
| 9 |
STN |
London |
4 |
2,9 % |
| 10 |
NRN |
Niederrhein |
4 |
2,9 % |
|
|
Top Ten Airlines
| # | Airline | Anzahl | Prozent |
|---|
| 1 |
Air Berlin |
23 |
33,3 % |
| 2 |
Condor |
11 |
15,9 % |
| 3 |
Ryanair |
6 |
8,7 % |
| 4 |
Lufthansa Cityline |
5 |
7,2 % |
| 5 |
Eurowings |
4 |
5,8 % |
| 6 |
easyJet |
4 |
5,8 % |
| 7 |
Lufthansa |
3 |
4,3 % |
| 8 |
American Airlines |
3 |
4,3 % |
| 9 |
SAS Scandinavian Airlines |
2 |
2,9 % |
| 10 |
Singapore Airlines |
2 |
2,9 % |
|
|
Top Ten Flugzeugtypen
| # | Flugzeugtyp | Anzahl | Prozent |
|---|
| 1 |
Boeing 737 |
24 |
34,8 % |
| 2 |
Airbus 320 |
22 |
31,9 % |
| 3 |
Canadair |
7 |
10,1 % |
| 4 |
Boeing 757 |
5 |
7,2 % |
| 5 |
Airbus 319 |
3 |
4,3 % |
| 6 |
Boeing 747 |
3 |
4,3 % |
| 7 |
Airbus 380 |
2 |
2,9 % |
| 8 |
McDonnell Douglas-83 |
1 |
1,4 % |
| 9 |
Embraer 170 |
1 |
1,4 % |
| 10 |
Airbus 330 |
1 |
1,4 % |
|
Top Ten Flugrouten
| # | Flugroute | Anzahl | Prozent |
|---|
| 1 |
PMI-PAD |
10 |
14,5 % |
| 2 |
PAD-PMI |
10 |
14,5 % |
| 3 |
PAD-MUC |
3 |
4,3 % |
| 4 |
MUC-PAD |
2 |
2,9 % |
| 5 |
PAD-STN |
2 |
2,9 % |
| 6 |
HAM-MAN |
1 |
1,4 % |
| 7 |
EDI-HAM |
1 |
1,4 % |
| 8 |
HAM-EDI |
1 |
1,4 % |
| 9 |
PAD-NUE |
1 |
1,4 % |
| 10 |
MCO-FRA |
1 |
1,4 % |
|
|
Zusatzinfos
| unterschiedliche Flughäfen | 31 |
|---|
| unterschiedliche Airlines | 14 |
|---|
| unterschiedliche Flugzeugtypen | 10 |
|---|
| unterschiedliche Flugzeuge | 31 |
|---|
| unterschiedliche Flugrouten | 47 |
|---|
| unterschiedliche Länder | 10 |
|---|
|


