Wie weit sind Sie in Ihrem Leben schon geflogen?

FlugStatistik - Statistik der Flüge des Users: malteseflier

Meine FlugStatistik  

deutsch english Simplified Chinese Traditiional Chinese espanol francais portugues Japanese Korean Turkish italiano Thai polski Ukrainian indonesia nederlands Rumänisch Filipino Hungarian Malaysia Czech Greek Serbian Bulgaria Swedish Belarusan Croatian Slovak Finnish Bosnian norsk dansk Hebrew Lithuanian Latvian Slovene Macedonian Estonian Montenegrin Luxembourgish Icelandic

Flugentfernung


Flugdauer


Flüge


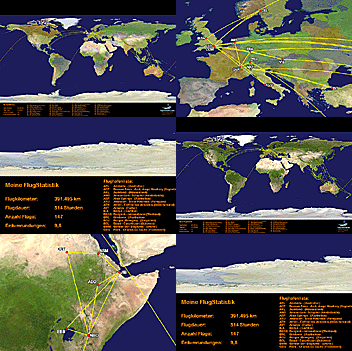
FlugStatistik Poster

in Kilometer  3.097.438
in Meilen  1.924.658
Erdumrundungen 77,29 mal
Flug zum Mond8,058 mal
Flug zur Sonne0,0207 mal
   
Stunden   3991:56
Tage166,3
Wochen23,8
Monate5,54
Jahre0,456
   
Gesamtanzahl  1100
Inland560
Kontinental ohne Inland 71
Interkontinental203
Sonstige Flüge266
   

weitester Flug: 8,119 mi, 15:01 h, Dallas/Fort Worth (International) - Hong Kong (International), 05-17-2016
längster Flug:15:01 h, 8,119 mi, Dallas/Fort Worth (International) - Hong Kong (International), 05-17-2016
kürzester Flug: 67 mi, 0:37 h, Chicago (O'Hare) - Milwaukee (General Mitchell), 08-30-2007
Mittel pro Flug: 1,750 mi, 3:38 h

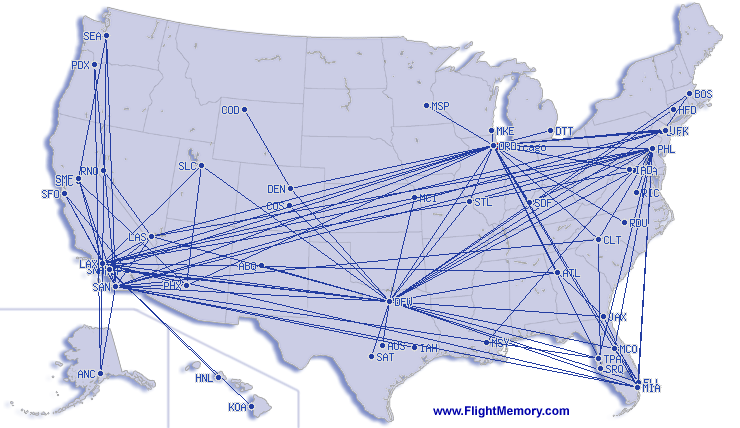
Inlandsflüge

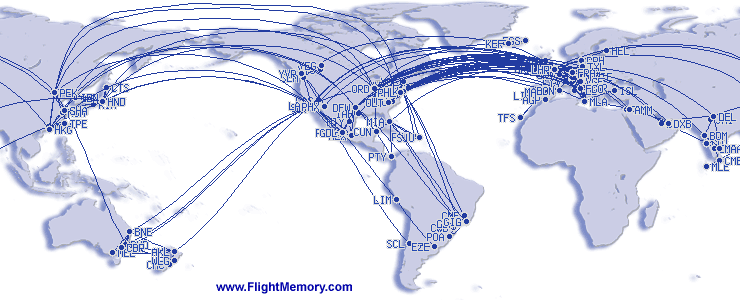
Weltkarte

Weltkarte

Top Ten Flughäfen

#Flughafen Anzahl Prozent 
1 SAN San Diego  278 12.6 %
2 ORD Chicago  210 9.5 %
3 LAX Los Angeles  200 9.1 %
4 DFW Dallas/Fort Worth  188 8.5 %
5 LHR London  146 6.6 %
6 PHL Philadelphia  121 5.5 %
7 MLA Malta  97 4.4 %
8 LAS Las Vegas  45 2.0 %
9 MIA Miami  42 1.9 %
10 JFK New York  41 1.9 %
  

Top Ten Airlines

#Airline Anzahl Prozent 
1 American Airlines 600 54.5 %
2 British Airways 80 7.3 %
3 Qantas Airways 50 4.5 %
4 US Airways 45 4.1 %
5 Air Malta 45 4.1 %
6 Alaska Airlines 43 3.9 %
7 America West Airlines 28 2.5 %
8 Lufthansa 19 1.7 %
9 Qatar Airways 16 1.5 %
10 Southwest Airlines 14 1.3 %
  

Top Ten Flugzeugtypen

#Flugzeugtyp Anzahl Prozent 
1 Boeing 737 199 18.1 %
2 McDonnell Douglas-80 142 12.9 %
3 Boeing 777 112 10.2 %
4 Airbus 320 88 8.0 %
5 Airbus 321 70 6.4 %
6 Boeing 757 51 4.6 %
7 Embraer 145 42 3.8 %
8 Airbus 319 37 3.4 %
9 Airbus 330 33 3.0 %
10 Boeing 767 31 2.8 %
 

Top Ten Flugrouten

#Flugroute Anzahl Prozent 
1 SAN-LAX 35 3.2 %
2 LAX-SAN 32 2.9 %
3 DFW-SAN 31 2.8 %
4 SAN-DFW 29 2.6 %
5 SAN-ORD 27 2.5 %
6 ORD-SAN 24 2.2 %
7 LHR-ORD 18 1.6 %
8 ORD-PHL 18 1.6 %
9 LAX-LHR 18 1.6 %
10 PHL-DFW 17 1.5 %
  

Zusatzinfos

unterschiedliche Flughäfen 147
unterschiedliche Airlines 59
unterschiedliche Flugzeugtypen  25
unterschiedliche Flugrouten 457
unterschiedliche Länder 40


 Aus unserem Shop 

Flugzeugmodell - Transavia - Airbus A321neo - 1:200
Transavia - Airbus A321neo - 1:200
Statistik-Poster - FlugStatistik Mousepad
FlugStatistik Mousepad
Flugzeugmodell - Saudia - Boeing 777-300ER - 1:200
Saudia - Boeing 777-300ER - 1:200