Wie weit sind Sie in Ihrem Leben schon geflogen?

FlugStatistik - Statistik der Flüge des Users: plon

Meine FlugStatistik  

deutsch english Simplified Chinese Traditiional Chinese espanol francais portugues Japanese Korean Turkish italiano Thai polski Ukrainian indonesia nederlands Rumänisch Filipino Hungarian Malaysia Czech Greek Serbian Bulgaria Swedish Belarusan Croatian Slovak Finnish Bosnian norsk dansk Hebrew Lithuanian Latvian Slovene Macedonian Estonian Montenegrin Luxembourgish Icelandic

Flugentfernung


Flugdauer


Flüge


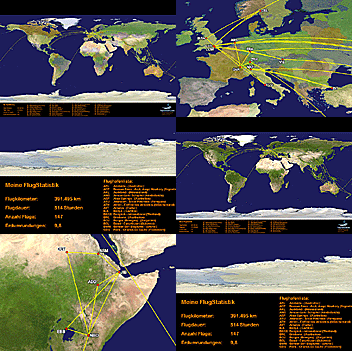
FlugStatistik Poster

in Kilometer  712.222
in Meilen  442.554
Erdumrundungen 17,77 mal
Flug zum Mond1,853 mal
Flug zur Sonne0,0048 mal
   
Stunden   981:32
Tage40,9
Wochen5,8
Monate1,36
Jahre0,112
   
Gesamtanzahl  244
Inland90
Kontinental ohne Inland 12
Interkontinental69
Sonstige Flüge73
   

weitester Flug: 8,772 mi, 16:11 h, Singapore (Changi Airport) - Los Angeles (International)
längster Flug:16:11 h, 8,772 mi, Singapore (Changi Airport) - Los Angeles (International)
kürzester Flug: 83 mi, 0:39 h, Greensboro High Point (Piedmont Triad) - Charlotte (Charlotte/Douglas International)
Mittel pro Flug: 1,814 mi, 4:01 h

Inlandsflüge

Weltkarte

Weltkarte

Top Ten Flughäfen

#Flughafen Anzahl Prozent 
1 CLT Charlotte  95 19.5 %
2 LHR London  53 10.9 %
3 LGW London  28 5.7 %
4 EWR Newark  17 3.5 %
5 LGA New York  14 2.9 %
6 FRA Frankfurt  13 2.7 %
7 MUC Munich  11 2.3 %
8 JFK New York  10 2.0 %
9 BHM Birmingham  9 1.8 %
10 ATL Atlanta  9 1.8 %
  

Top Ten Airlines

#Airline Anzahl Prozent 
1 US Airways 77 31.6 %
2 Lufthansa 20 8.2 %
3 Virgin Atlantic Airways 14 5.7 %
4 USAir 14 5.7 %
5 American Airlines 13 5.3 %
6 United Airlines 11 4.5 %
7 EasyJet 10 4.1 %
8 bmi British Midland International 8 3.3 %
9 Continental Airlines 8 3.3 %
10 British Airways 7 2.9 %
  

Top Ten Flugzeugtypen

#Flugzeugtyp Anzahl Prozent 
1 Airbus 321 43 17.6 %
2 Airbus 333 22 9.0 %
3 Airbus 320 15 6.1 %
4 Boeing 777 14 5.7 %
5 BOEING 747-400 14 5.7 %
6 Airbus 340 13 5.3 %
7 Canadair CRJ-900 10 4.1 %
8 Boeing 767 9 3.7 %
9 Boeing 737 6 2.5 %
10 Airbus 319 5 2.0 %
 

Top Ten Flugrouten

#Flugroute Anzahl Prozent 
1 LGW-CLT 10 4.1 %
2 CLT-LGW 9 3.7 %
3 LHR-EWR 7 2.9 %
4 CLT-LGA 5 2.0 %
5 LGA-CLT 5 2.0 %
6 JFK-LHR 4 1.6 %
7 CLT-BHM 3 1.2 %
8 EWR-LHR 3 1.2 %
9 LHR-IAD 2 0.8 %
10 LHR-DUB 2 0.8 %
  

Zusatzinfos

unterschiedliche Flughäfen 98
unterschiedliche Airlines 36
unterschiedliche Flugzeugtypen  36
unterschiedliche Flugzeuge 4
unterschiedliche Flugrouten 189
unterschiedliche Länder 34


 Aus unserem Shop 

Flugzeugmodell - Garuda Indonesia - MD11 - 1:200
Garuda Indonesia - MD11 - 1:200
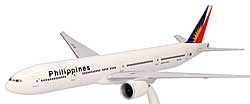
Flugzeugmodell - Philippine Airlines - Boeing 777-300ER - 1:200
Philippine Airlines - Boeing 777-300ER - 1:200
Statistik-Poster - FlugStatistik Mousepad
FlugStatistik Mousepad