Wie weit sind Sie in Ihrem Leben schon geflogen?

FlugStatistik - Statistik der Flüge des Users: tropicaltripper

Meine FlugStatistik  

deutsch english Simplified Chinese Traditiional Chinese espanol francais portugues Japanese Korean Turkish italiano Thai polski Ukrainian indonesia nederlands Rumänisch Filipino Hungarian Malaysia Czech Greek Serbian Bulgaria Swedish Belarusan Croatian Slovak Finnish Bosnian norsk dansk Hebrew Lithuanian Latvian Slovene Macedonian Estonian Montenegrin Luxembourgish Icelandic

Flugentfernung


Flugdauer


Flüge


FlugStatistik Poster

in Kilometer  3.268.692
in Meilen  2.031.071
Erdumrundungen 81,56 mal
Flug zum Mond8,503 mal
Flug zur Sonne0,0218 mal
   
Stunden   4798:22
Tage199,9
Wochen28,6
Monate6,66
Jahre0,548
   
Gesamtanzahl  1531
Inland1082
Kontinental ohne Inland 88
Interkontinental106
Sonstige Flüge255
   

weitester Flug: 8,387 mi, 16:15 h, Los Angeles (International) - Abu Dhabi (International), 04-17-2017
längster Flug:16:35 h, 8,068 mi, Abu Dhabi (International) - Dallas/Fort Worth (International), 02-03-2017
kürzester Flug: 10 mi, 0:08 h, Kichwa Tembo - Musiara, 04-10-2010
Mittel pro Flug: 1,327 mi, 3:08 h

Inlandsflüge

weitere Karte(n)

Europakarte

Europakarte
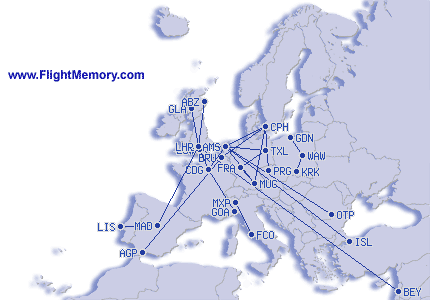
Klick in die Europakarte zur Vergrößerung
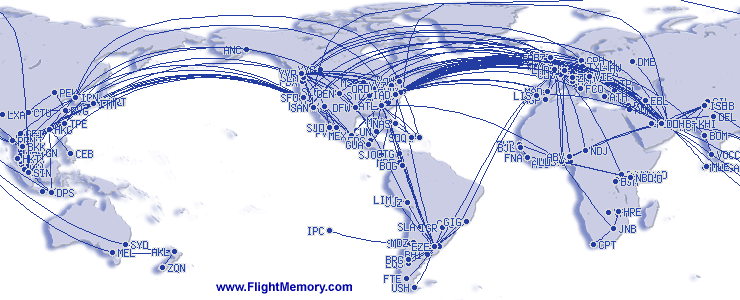
Weltkarte

Weltkarte

Top Ten Flughäfen

#Flughafen Anzahl Prozent 
1 SEA Seattle  527 17.2 %
2 PHX Phoenix  230 7.5 %
3 DCA Washington  188 6.1 %
4 LAX Los Angeles  148 4.8 %
5 OAK Oakland  139 4.5 %
6 SAN San Diego  107 3.5 %
7 LAS Las Vegas  97 3.2 %
8 ATL Atlanta  92 3.0 %
9 IAD Washington  58 1.9 %
10 SFO San Francisco  50 1.6 %
  

Top Ten Airlines

#Airline Anzahl Prozent 
1 America West Airlines 242 15.8 %
2 Delta Air Lines 185 12.1 %
3 Southwest Airlines 165 10.8 %
4 American Airlines 159 10.4 %
5 Alaska Airlines 133 8.7 %
6 United Airlines 97 6.3 %
7 US Airways 61 4.0 %
8 Qatar Airways 34 2.2 %
9 Horizon Air 27 1.8 %
10 Continental Airlines 25 1.6 %
  

Top Ten Flugzeugtypen

#Flugzeugtyp Anzahl Prozent 
1 Boeing 737 170 11.1 %
2 Airbus 320 158 10.3 %
3 Boeing 737-800 138 9.0 %
4 Boeing 737-300 120 7.8 %
5 Boeing 757-200 71 4.6 %
6 Airbus 319 63 4.1 %
7 Boeing 767-300 43 2.8 %
8 McDonnell Douglas-80 43 2.8 %
9 Boeing 737-700 38 2.5 %
10 Airbus 321 37 2.4 %
 

Top Ten Flugrouten

#Flugroute Anzahl Prozent 
1 PHX-SEA 55 3.6 %
2 SEA-OAK 54 3.5 %
3 SEA-PHX 48 3.1 %
4 OAK-SEA 47 3.1 %
5 SEA-LAX 22 1.4 %
6 LAX-SEA 20 1.3 %
7 SAN-SEA 18 1.2 %
8 DCA-ATL 17 1.1 %
9 LAS-SEA 16 1.0 %
10 SEA-LAS 15 1.0 %
  

Zusatzinfos

unterschiedliche Flughäfen 213
unterschiedliche Airlines 82
unterschiedliche Flugzeugtypen  81
unterschiedliche Flugzeuge 661
unterschiedliche Flugrouten 710
unterschiedliche Länder 62
unterschiedliche Kontinente 6


 Aus unserem Shop 

Statistik-Poster - FlugStatistik Mousepad
FlugStatistik Mousepad
Flugzeugmodell - Virgin Atlantic - Boeing 787-9 - 1:200 - PremiumModell
Virgin Atlantic - Boeing 787-9 - 1:200 - PremiumModell
Flugzeugmodell - SWISS - Airbus A340-300 - 1:200 - PremiumModell
SWISS - Airbus A340-300 - 1:200 - PremiumModell