Wie weit sind Sie in Ihrem Leben schon geflogen?
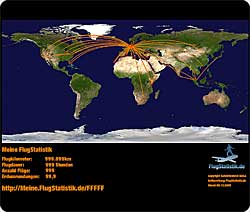
Meine FlugStatistik
|
|
Flugentfernung |
Flugdauer |
Flüge |
FlugStatistik Poster |
|||||||||||||||||||||||||||||||||
|---|---|---|---|---|---|---|---|---|---|---|---|---|---|---|---|---|---|---|---|---|---|---|---|---|---|---|---|---|---|---|---|---|---|---|---|---|
|
|
|
 |
| weitester Flug: | 10,122 mi, 15:34 h, Singapore (Changi) - San Francisco (International), 07-06-2016 |
| längster Flug: | 17:00 h, 8,062 mi, Newark (Liberty) - Hong Kong (International), 11-20-2018 |
| kürzester Flug: | 29 mi, 0:33 h, Houston (Ellington Field) - Houston (George Bush Intercontinental), 12-29-1997 |
| Mittel pro Flug: | 1,016 mi, 2:32 h |
Inlandsflüge
|
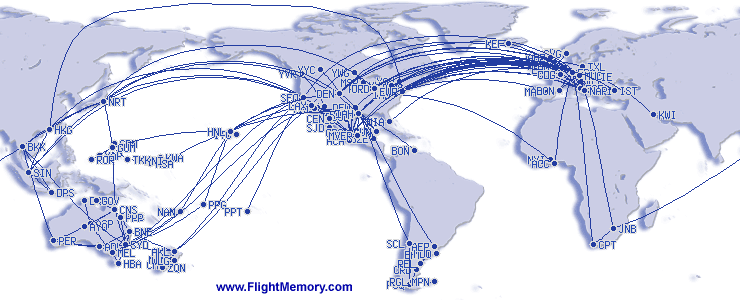
Weltkarte | |
|
Top Ten Flughäfen
|
Top Ten Airlines
|
Top Ten Flugzeugtypen
|
|||||||||||||||||||||||||||||||||||||||||||||||||||||||||||||||||||||||||||||||||||||||||||||||||||||||||||||||||||||||||||||||||||||||||||||||||
Top Ten Flugrouten
|
Zusatzinfos
|
||||||||||||||||||||||||||||||||||||||||||||||||||||||||||||||||||||||||||||||||||||||||||||||||||||||||||||||||||||||||||||||||||||||||||||||||||