Wie weit sind Sie in Ihrem Leben schon geflogen?

FlugStatistik - Statistik der Flüge des Users: miguelrei

Meine FlugStatistik  

deutsch english Simplified Chinese Traditiional Chinese espanol francais portugues Japanese Korean Turkish italiano Thai polski Ukrainian indonesia nederlands Rumänisch Filipino Hungarian Malaysia Czech Greek Serbian Bulgaria Swedish Belarusan Croatian Slovak Finnish Bosnian norsk dansk Hebrew Lithuanian Latvian Slovene Macedonian Estonian Montenegrin Luxembourgish Icelandic

Flugentfernung


Flugdauer


Flüge


FlugStatistik Poster

in Kilometer  165.164
in Meilen  102.628
Erdumrundungen 4,12 mal
Flug zum Mond0,430 mal
Flug zur Sonne0,0011 mal
   
Stunden   213:58
Tage8,9
Wochen1,3
Monate0,30
Jahre0,024
   
Gesamtanzahl  85
Inland17
Kontinental ohne Inland 41
Interkontinental20
Sonstige Flüge7
   

weitester Flug: 10,058 km, 10:57 h, São Paulo (Guarulhos) - Amsterdam (Schiphol), 09.03.2022
längster Flug:11:05 h, 9,836 km, Amsterdam (Schiphol) - Rio de Janeiro (Galeao), 26.02.2022
kürzester Flug: 277 km, 0:27 h, Lisbon (Portela) - Porto (Francisco Sa Carneiro), 06.07.2010
Mittel pro Flug: 1,943 km, 2:31 h

Inlandsflüge

Europakarte

Europakarte
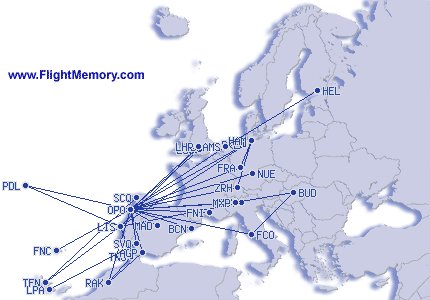
Klick in die Europakarte zur Vergrößerung
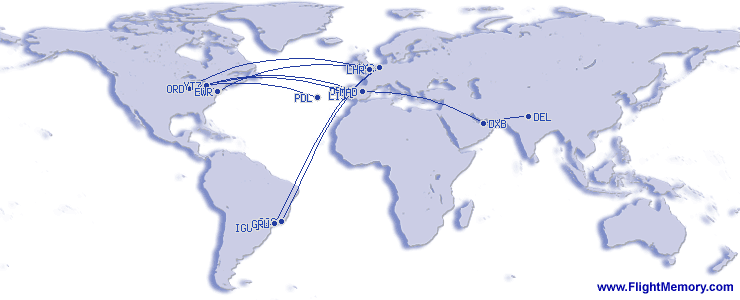
Weltkarte

Weltkarte

Top Ten Flughäfen

#Flughafen Anzahl Prozent 
1 OPO Porto  49 28.8 %
2 LIS Lisbon  20 11.8 %
3 AMS Amsterdam  8 4.7 %
4 YYZ Toronto  7 4.1 %
5 PDL Ponta Delgada  6 3.5 %
6 HAM Hamburg  6 3.5 %
7 BCN Barcelona  6 3.5 %
8 LHR London  5 2.9 %
9 DXB Dubai  4 2.4 %
10 RAK Marrakech  4 2.4 %
  

Top Ten Airlines

#Airline Anzahl Prozent 
1 Ryanair 25 29.4 %
2 Vueling Airlines 9 10.6 %
3 TAP Air Portugal 7 8.2 %
4 SATA International 6 7.1 %
5 Air Transat 4 4.7 %
6 Emirates Airlines 4 4.7 %
7 KLM Cityhopper 4 4.7 %
8 British Airways 4 4.7 %
9 Wizz Air 3 3.5 %
10 KLM Royal Dutch Airlines 3 3.5 %
  

Top Ten Flugzeugtypen

#Flugzeugtyp Anzahl Prozent 
1 Boeing 737-800 27 31.8 %
2 Airbus 320 15 17.6 %
3 Airbus 310 9 10.6 %
4 Airbus 319 6 7.1 %
5 Boeing 777-300ER 5 5.9 %
6 Airbus 320neo 4 4.7 %
7 Airbus 321neo 4 4.7 %
8 Airbus 380 3 3.5 %
9 Embraer 190 3 3.5 %
10 Embraer 195-E2 2 2.4 %
 

Top Ten Flugrouten

#Flugroute Anzahl Prozent 
1 OPO-LIS 5 5.9 %
2 LIS-OPO 4 4.7 %
3 BCN-OPO 3 3.5 %
4 OPO-BCN 3 3.5 %
5 OPO-PDL 2 2.4 %
6 YYZ-OPO 2 2.4 %
7 AMS-OPO 2 2.4 %
8 PDL-YYZ 2 2.4 %
9 LIS-HAM 2 2.4 %
10 OPO-AMS 2 2.4 %
  

Zusatzinfos

unterschiedliche Flughäfen 39
unterschiedliche Airlines 22
unterschiedliche Flugzeugtypen  15
unterschiedliche Flugzeuge 75
unterschiedliche Flugrouten 68
unterschiedliche Länder 16


 Aus unserem Shop 

Statistik-Poster - FlugStatistik Mousepad
FlugStatistik Mousepad
Flugzeugmodell - Qantas - Airbus A330-300 - 1:200
Qantas - Airbus A330-300 - 1:200
Flugzeugmodell - Air India - Airbus A320-200 - 1:200 - PremiumModell
Air India - Airbus A320-200 - 1:200 - PremiumModell