Wie weit sind Sie in Ihrem Leben schon geflogen?
Meine FlugStatistik
|
|
Flugentfernung |
Flugdauer |
Flüge |
FlugStatistik Poster |
|||||||||||||||||||||||||||||||||
|---|---|---|---|---|---|---|---|---|---|---|---|---|---|---|---|---|---|---|---|---|---|---|---|---|---|---|---|---|---|---|---|---|---|---|---|---|
|
|
|
 |
| weitester Flug: | 13,822 km, 15:07 h, Sydney (Kingsford Smith) - Dallas/Fort Worth (International), 09.06.2012 |
| längster Flug: | 16:27 h, 13,379 km, Dallas/Fort Worth (International) - Brisbane (International), 11.06.2012 |
| kürzester Flug: | 65 km, 0:26 h, Narrandera - Griffith, 27.05.2017 |
| Mittel pro Flug: | 1,923 km, 2:47 h |
Inlandsflüge
|
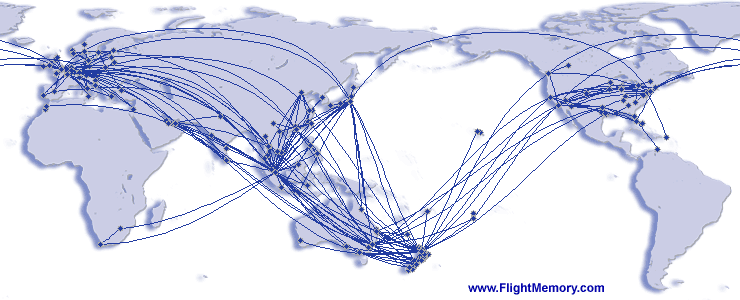
Weltkarte | |
|
Top Ten Flughäfen
|
Top Ten Airlines
|
Top Ten Flugzeugtypen
|
|||||||||||||||||||||||||||||||||||||||||||||||||||||||||||||||||||||||||||||||||||||||||||||||||||||||||||||||||||||||||||||||||||||||||||||||||
Top Ten Flugrouten
|
Zusatzinfos
|
||||||||||||||||||||||||||||||||||||||||||||||||||||||||||||||||||||||||||||||||||||||||||||||||||||||||||||||||||||||||||||||||||||||||||||||||||