Wie weit sind Sie in Ihrem Leben schon geflogen?
Meine FlugStatistik
|
|
Flugentfernung |
Flugdauer |
Flüge |
FlugStatistik Poster |
|||||||||||||||||||||||||||||||||
|---|---|---|---|---|---|---|---|---|---|---|---|---|---|---|---|---|---|---|---|---|---|---|---|---|---|---|---|---|---|---|---|---|---|---|---|---|
|
|
|
 |
| weitester Flug: | 9,025 mi, 17:50 h, Perth - London (Heathrow), 28.01.2026 |
| längster Flug: | 17:50 h, 9,025 mi, Perth - London (Heathrow), 28.01.2026 |
| kürzester Flug: | 4 mi, 0:02 h, Westray - Papa Westray, 22.07.2014 |
| Mittel pro Flug: | 2,338 mi, 5:01 h |
Inlandsflüge
|
Europakarte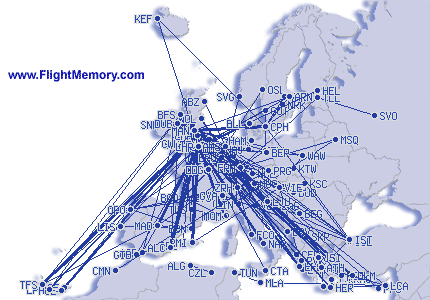 Klick in die Europakarte zur Vergrößerung |
weitere Karte(n)
|
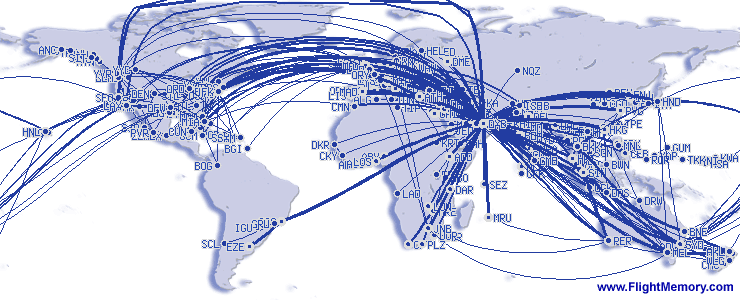
Weltkarte | |
|
Top Ten Flughäfen
|
Top Ten Airlines
|
Top Ten Flugzeugtypen
|
|||||||||||||||||||||||||||||||||||||||||||||||||||||||||||||||||||||||||||||||||||||||||||||||||||||||||||||||||||||||||||||||||||||||||||||||||
Top Ten Flugrouten
|
Zusatzinfos
|
||||||||||||||||||||||||||||||||||||||||||||||||||||||||||||||||||||||||||||||||||||||||||||||||||||||||||||||||||||||||||||||||||||||||||||||||||