Wie weit sind Sie in Ihrem Leben schon geflogen?
Mi Historial de Vuelos
|
|
Distancia volada |
Tiempo de vuelo |
Vuelos |
FlugStatistik Poster |
|||||||||||||||||||||||||||||||||
|---|---|---|---|---|---|---|---|---|---|---|---|---|---|---|---|---|---|---|---|---|---|---|---|---|---|---|---|---|---|---|---|---|---|---|---|---|
|
|
|
 |
| Vuelo más largo (Distancia): | 9,540 mi, 18:35 h, Newark (Liberty) - Singapore (Changi Airport), 16.07.2004 |
| Vuelo más largo (Duración): | 18:55 h, 9,540 mi, Newark (Liberty) - Singapore (Changi Airport), 11.01.2005 |
| Vuelo más corto: | 55 mi, 0:35 h, Philadelphia (International) - Allentown (Lehigh Valley International), 05.02.2002 |
| Vuelo Medio: | 981 mi, 2:40 h |
Vuelos Nacionales
|
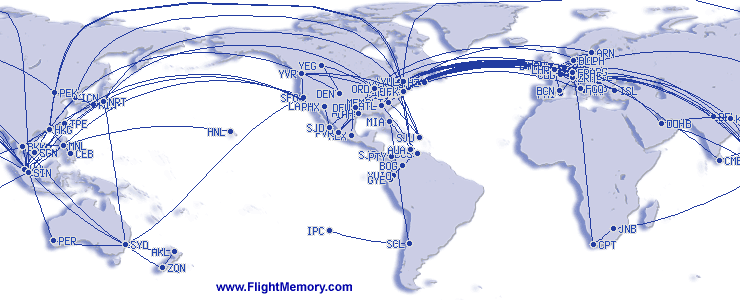
Mapamundi | |
|
Top Ten Aeropuertos
|
Top Ten Aerolíneas
|
Top Ten Aviones
|
|||||||||||||||||||||||||||||||||||||||||||||||||||||||||||||||||||||||||||||||||||||||||||||||||||||||||||||||||||||||||||||||||||||||||||||||||
Top Ten Rutas
|
Información Adicional
|
||||||||||||||||||||||||||||||||||||||||||||||||||||||||||||||||||||||||||||||||||||||||||||||||||||||||||||||||||||||||||||||||||||||||||||||||||