Wie weit sind Sie in Ihrem Leben schon geflogen?

FlugStatistik - Statistik der Flüge des Users: thewayofthefuture

Meine FlugStatistik  

deutsch english Simplified Chinese Traditiional Chinese espanol francais portugues Japanese Korean Turkish italiano Thai polski Ukrainian indonesia nederlands Rumänisch Filipino Hungarian Malaysia Czech Greek Serbian Bulgaria Swedish Belarusan Croatian Slovak Finnish Bosnian norsk dansk Hebrew Lithuanian Latvian Slovene Macedonian Estonian Montenegrin Luxembourgish Icelandic

Flugentfernung


Flugdauer


Flüge


FlugStatistik Poster

in Kilometer  2.713.883
in Meilen  1.686.328
Erdumrundungen 67,72 mal
Flug zum Mond7,060 mal
Flug zur Sonne0,0181 mal
   
Stunden   3696:14
Tage154,0
Wochen22,0
Monate5,13
Jahre0,422
   
Gesamtanzahl  1315
Inland940
Kontinental ohne Inland 33
Interkontinental140
Sonstige Flüge202
   

weitester Flug: 7,936 mi, 15:04 h, Los Angeles (International) - Melbourne (Tullamarine), 11-19-2017
längster Flug:15:18 h, 7,803 mi, New York (John F. Kennedy) - Taipei (Taoyuan International), 11-21-2013
kürzester Flug: 17 mi, 0:11 h, Westerly (State) - Block Island, 07-24-2022
Mittel pro Flug: 1,283 mi, 2:49 h

Inlandsflüge

weitere Karte(n)

Europakarte

Europakarte
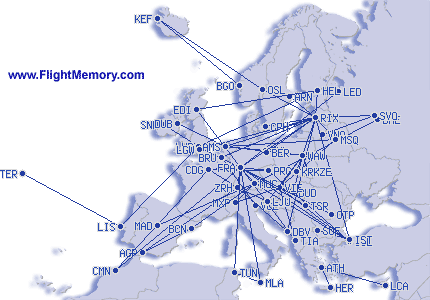
Klick in die Europakarte zur Vergrößerung
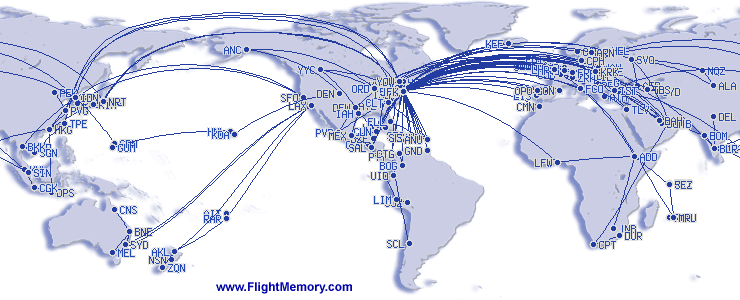
Weltkarte

Weltkarte

Top Ten Flughäfen

#Flughafen Anzahl Prozent 
1 EWR Newark  290 11.0 %
2 LGA New York  236 9.0 %
3 IAD Washington  167 6.3 %
4 SFO San Francisco  135 5.1 %
5 JFK New York  120 4.6 %
6 ORD Chicago  113 4.3 %
7 ATL Atlanta  110 4.2 %
8 CLT Charlotte  88 3.3 %
9 BOS Boston  86 3.3 %
10 IAH Houston  67 2.5 %
  

Top Ten Airlines

#Airline Anzahl Prozent 
1 United 676 51.4 %
2 US Airways 118 9.0 %
3 Delta 115 8.7 %
4 American 79 6.0 %
5 Lufthansa 43 3.3 %
6 Air Canada 25 1.9 %
7 Turkish Airlines 20 1.5 %
8 LOT Polish Airlines 16 1.2 %
9 Air Baltic 13 1.0 %
10 British Airways 10 0.8 %
  

Top Ten Flugzeugtypen

#Flugzeugtyp Anzahl Prozent 
1 Boeing 737-800 130 9.9 %
2 Airbus A320 129 9.8 %
3 Airbus A319 101 7.7 %
4 Embraer 145 92 7.0 %
5 Boeing 757-200 81 6.2 %
6 Airbus A321 79 6.0 %
7 Boeing 737-900 73 5.6 %
8 CRJ200 69 5.2 %
9 Embraer 175 58 4.4 %
10 CRJ700 49 3.7 %
 

Top Ten Flugrouten

#Flugroute Anzahl Prozent 
1 IAD-LGA 28 2.1 %
2 ORD-LGA 26 2.0 %
3 JFK-IAD 23 1.7 %
4 LGA-ORD 21 1.6 %
5 SFO-BOS 17 1.3 %
6 BOS-SFO 16 1.2 %
7 LGA-IAD 14 1.1 %
8 LGA-CLT 13 1.0 %
9 EWR-CMH 13 1.0 %
10 SFO-EWR 13 1.0 %
  

Zusatzinfos

unterschiedliche Flughäfen 223
unterschiedliche Airlines 72
unterschiedliche Flugzeugtypen  64
unterschiedliche Flugzeuge 1068
unterschiedliche Flugrouten 681
unterschiedliche Länder 79
unterschiedliche Kontinente 6


 Aus unserem Shop 

Statistik-Poster - FlugStatistik Mousepad
FlugStatistik Mousepad
Flugzeugmodell - Western Pacific - Boeing 737-300 - 1:200
Western Pacific - Boeing 737-300 - 1:200
Schlüsselanhänger - Airbus - A400M - Olivgrün
Airbus - A400M - Olivgrün